
Mat-Su Valley Real Estate Homes for Sale Statistics for May 2026

Unemployment Rates
The unemployment rate is a great market indicator for the future market. As long as employment numbers are strong, mortgages will be paid and manufactured items will be purchased. Unemployment rates can greatly affect how many homes sale in the Mat-Su Valley.
National Unemployment Rate
2026

January 4.3%
February 4.4%
March 4.3%
April 4.3%
May 4.3%
June
July
August
September
October
November
December
Adam's Insight: The unemployment rate has stayed between 4.2% and 4.4% for the last year. This is a stable market, however, inflation has been steadily increasing. A healthy market means interest rates should start to come down. Slowly but surely we will see lower interest rates.
Alaska Unemployment Rate

2026
January 4.8%
February 4.7%
March 4.7%
April 4.6%
May 4.6%
June 4.4%
July
August
September
October
November
December
Adam's Insight: Alaska has an interesting labor market. It is not easy or cheap to live in Alaska, however our unemployment rate is usually higher than the rest of the country. This is due the native community and many homesteaders. It is usually difficult to find workers, it is because everyone is working that wants to work.
30 Year Mortgage Rate Average in United States
*This information is pulled from the Federal Reserve and Freddie Mac. These are averages for information purposes only. This information is for the first day of the month; remember that a lot can change in 30 days.

2026
January 6.15%
February 6.11%
March 6.00%
April 6.46%
May 6.37%
June
July
August
September
October
November
December
Adam's Insight: The interest rates have not changed in the last year. I believed that once President Trump made changes in the #FED, we would see a reduction in interest rates. However, that has not happened. I believe it is due to inflation is slowly increasing and our cost of living is increasing at a faster rate than is digestible by most people.
Spot Gold Price (Price per Ounce)

2025
Spot Silver Price

2026
Mat-Su Valley Home Sales Statistics
Matanuska-Susitna Properties Sold

2026
January 76
February 80
March 111
April 140
May 174
June
July
August
September
October
November
December
Adam's Insight: Alaska has a strong real estate market that is extremely seasonal. In peak summer we sell 190+ homes a month, and in the winter we get down to the 70's. The good news is if your selling in the winter a buyer must buy and is very motivated. The bad news is that it is a smaller buyer pool.
Matanuska-Susitna New Listings

2026
January 147
February 158
March 241
April 254
May 324
June
July
August
September
October
November
December
Matanuska-Susitna Active Listings

2026
January 350
February 337
March 376
April 400
May 478
June
July
August
September
October
November
December
Matanuska-Susitna Absorption Rate

2026
January 2.36
February 2.30
March 2.59
April 2.75
May 3.32
June
July
August
September
October
November
December
Matanuska-Susitna Average Sales Price

2026
January $446,322
February $405,654
March $437,200
April $447,087
May $461,904
June
July
August
September
October
November
December
Matanuska-Susitna Median Days on Market
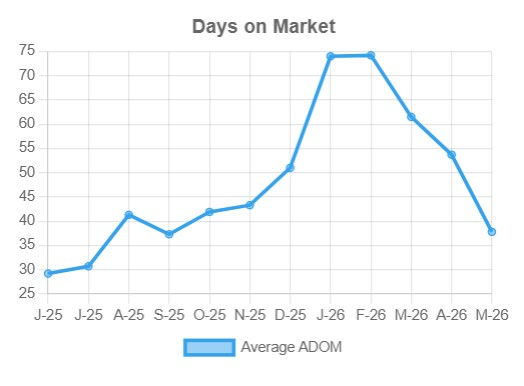
2026
January 36
February 59
March 25
April 11
May 11
June
July
August
September
October
November
December
Written by Associate Broker Adam Maxfield
Real Estate Sales and Investing
Gold Spruce
(907) 803-8788
Real Estate Brokers of Alaska


Comments